


With latest round of property re-evaluations on hold, an interesting question presents itself: Are higher tax bills the result of higher tax rates or rising home values? To answer that question, I compiled county tax rates from every North Carolina county together with Census home value estimates spanning the last decade.1
The answer is more complicated than you might think.
Tax Rates Are Only Half the Story
Property tax bills are determined by two numbers: the assessed value of your home, and the tax rate set by your local county commissioners and city/town council (if you live inside the city limits). I focused only on the tax rates of the 100 counties in the state in order to keep things relatively simple (there are over 540 cities and towns in NC). The map below shows the change in the actual rate from July 1, 2016 to June 30, 2026 (you can roll over your county to see your local data):
Two things stand out right away. The first is that the counties with the largest rate reductions (in dark and light blue) also tend to be the counties that have experienced the fastest population and economic growth over the last 10 years. On the other hand, what is notable is that 20% of the counties in NC actually raised their rates over the last 10 years (dark orange), and another 20% effectively kept their rates flat (the lighter orange). These areas are clustered in the far western part of the state, as well as the northeastern corner of the state, and in the counties along the eastern stretch of US 74 between Charlotte and Wilmington.
The Importance of Home Values
The other half of the equation is, of course, the assessed value of your home, which varies considerably from county to county. The map below takes the median home value in 2016 and 2024 (which was the last year such data was available) and then multiplies it by the tax rate in 2016 and 2026 to calculate the change in the tax bill you would have received in each county.
There’s quite a bit of overlap with the previous map- a lot of the counties with the largest dollar increases are also those counties with the largest cuts in their rates. Mecklenburg County is actually a good illustration of this trend, cutting its tax rate by about 30 cents. However, the median property value surged from $192k to $406k, which resulted in tax bills increasing by 28% over ten years. Interestingly, Mecklenburg actually had one of the lower increases in tax bills among the urban counties, with most of the other urban counties seeing increases of 60+%, largely a result of the same property value trends.
Compare that to New Hanover County, which saw property values increase from $215k to $387k and had to cut its tax rate in half (from 62.3 cents to 30.6 cents) in order to keep tax bills at the same level.
The biggest takeaway is that tax rates are only part of the story. Many counties cut tax rates (some drastically), but homeowners still saw substantially larger tax bills as home values increased even faster. In many communities, rising home values are also accompanied by population growth and additional demand for schools, roads, police, fire protection, and other public services. And that all costs money. It isn’t a coincidence that the fastest growing counties are also seeing property taxes increase faster than average. What this suggests is that when you see the value of your home increase quickly, a larger tax bill is likely on the way, regardless of what the county commission does with the tax rate.
How Does Your Bill Stack Up?
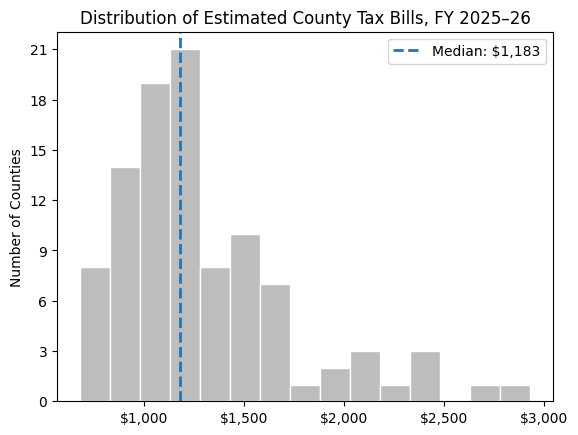
The chart below shows the distribution of the current year’s tax bills by county, with a median value (across all 100 counties) just shy of $1200. Most counties cluster close to the statewide median, but there are a handful of outliers where the combination of rising property values and local tax rates has produced significantly higher tax bills.
What’s interesting is that there are about 10 outliers above the $2000 mark, and there are some unexpected entries on the list (which you can see below). It isn’t a clear red vs. blue or urban vs. rural breakdown.
Looking Ahead
This analysis looked at county taxes, but what happens when you layer municipal taxes on top? How do municipal taxes change the picture, and where is the combined city/county tax bill increasing the fastest? That’s where the story gets even more interesting. Subscribe below (for free) to get the latest analysis.
County tax rates were compiled from annual county tax schedules, while home values come from the U.S. Census Bureau's American Community Survey.